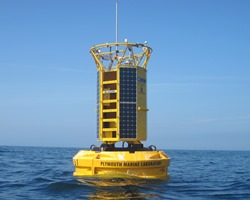
E1 Scientific Buoy
As part of the NERC Oceans 2025 programme in 2007, PML were awarded a capital grant to build autonomous buoys for the long-term stations at L4 and E1. Originally both L4 and E1 were populated by the same design buoy constructed by Hippo Marine with systems design and integration carried out by PML. However, during 2012 the opportunity arose to collaborate with the UK Met Office who were rolling out a new hull design to replace their 30-year-old K-series. More recently (2021) working in partnership with the Met Office the E1 buoy has been upgraded to a larger 4 m platform, which was provided by Mobilis through their UK supplier Hydrosphere. The float is the same design as the new L4 buoy but the tower on the E1 buoy is slightly smaller in diameter.
Power:
800 Watts of solar charge into an 800 Ah battery bank.
Communications:
Steatite Wave Relay meshed network, which provides high bandwidth connectivity between PML and the buoy.
In Water Measurements:
Sea surface temperature, salinity, dissolved oxygen, chlorophyll a, turbidity and CDOM. Also, spectral waves.
Atmospheric Measurements:
Met Office weather sensor measuring air temperature, humidity, wind speed and direction, atmospheric pressure, sunlight intensity
05/09/2024: E1 buoy operational - met only currently; L4 buoy partially operational.
E1 Databuoy
Latest Buoy Position
Latest E1 data readings (50°02.6'N; 4°22.5'W)
Buoy automatic position given as DD.dd where:
DD degrees, dd decimal degrees
| Latitude: | 50.044 ° | Longitude: | -4.374 ° |
| Wind direction: | 64.3 ° | Sea temperature: | 11.4 °C |
| Wind speed: | 4.3 ms-1 | Salinity: | -10.00 |
| Pressure: | 1010 mb | Oxygen: | -999.9 μM |
| PAR: | -10 W m-2 | Chlorophyll: | -10.00 mg m-3 |
| Air temperature: | 9.7 °C | Turbidity: | -10.00 NTU |
| Sig. wave height: | 0.8 m | Max. wave height: | 1.30 m |
| Peak wave period: | 8.5 s | Wave Direction | 216 ° |
Last Reading taken at: 6.00 GMT on 17/04/2025
* Readings of -10 indicate missing data
Click here to download preliminary data. Final, quality controlled data are available on request. The meteorological parameters for this buoy are also available from the UK Met Office
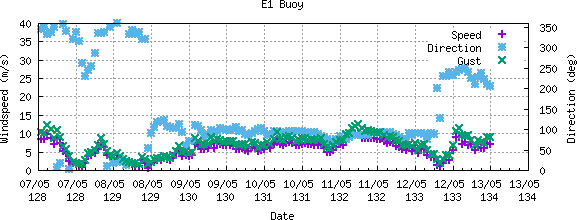
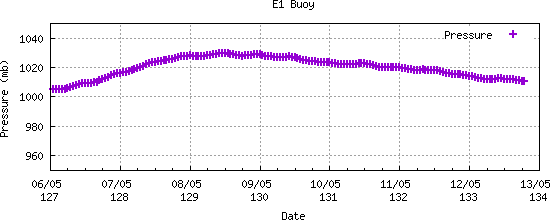
Last 7 days met data
Windspeed and direction
Pressure
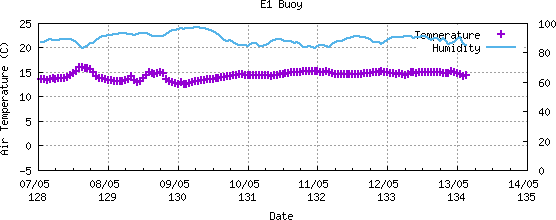
Air Temperature and Humidity
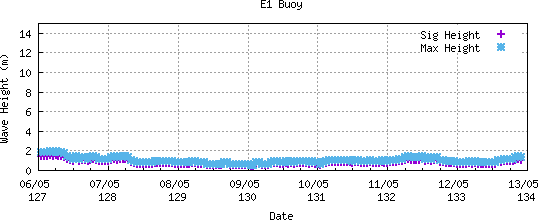
Wave Height
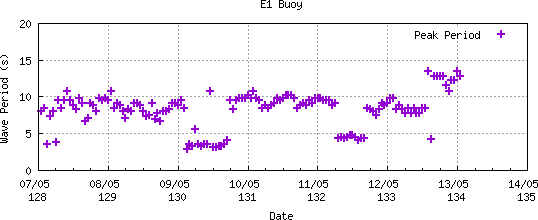
Wave Period
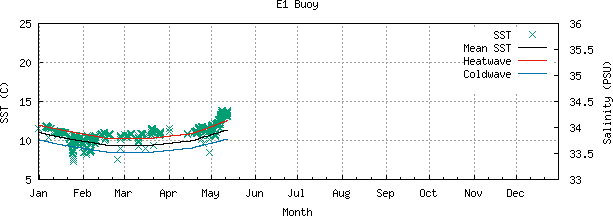
Latest year in context
Temperature and Salinity
Oxygen, Fluorescence and Turbidity
Nitrate and CDOM