R.V. Plymouth Quest underway data
The R.V. Plymouth Quest is fitted with an underway suite of sensors, which continuously sample from the vessels non-toxic underway water supply. The data has now been made available utilising Google Earth as a means of visualisation.
The seawater system was carefully designed with a stainless steel pipe extruding 1 m below the hull. This is to eliminate the risk of sucking in the aerated bow wave water as it streams down the hull of the vessel. A SeaBird digital thermometer is fitted less than 6 inches from the hull (inlet_temp (deg.C) on Google Earth file). The water is then piped 6 m to the rest of the sensors, which comprise of a Sea Bird thermosalinograph (SBE 45; temperature (deg. C) and Salinity (PSU)), an Aandera Oxygen optode (uM), Wetlabs C-Star transmissometer (Red; light attenuation (%)), Wetlabs three way ECO sensor measuring Chlorophyll a (mg.m-3), turbidity (NTU) and coloured dissolved organic material (CDOM, ppb). Also fitted to the system is an AirMar PB100 Met station (wind speed (knots), wind direction (degrees), air temperature (deg.C) Humidity (%) and atmospheric pressure (mb)). A Satlantic above water PAR sensor is also fitted to the top of the mast measuring light intensity (uE.m-2.s-1). The optical water sensors are provided with water directly from a vortex de-bubbler to ensure the measurements are accurate and not contaminated by bubbles.
The control software was developed by PML and logs all data on a 60 second frequency interfacing it with date, time and position information from the vessels navigation system. Wind speed and direction are also corrected for vessel speed and course.
Any problems or to request the raw .csv files then contact James Fishwick
Click here to download the individual day files to load into Google Earth.
Instructions on visualisation
- It is advisable to download and install the latest version of Google Earth on your machine. Go to http://earth.google.co.uk/download-earth.html
- To download the files right-click and select save, at this point on some machines the files are wrongly assigned as compressed files. To assign the appropriate file extension then select ‘all files’ from the file type prompt and add .kmz after the file name.
- Once the file has downloaded click open and the file will be loaded straight into Google Earth.
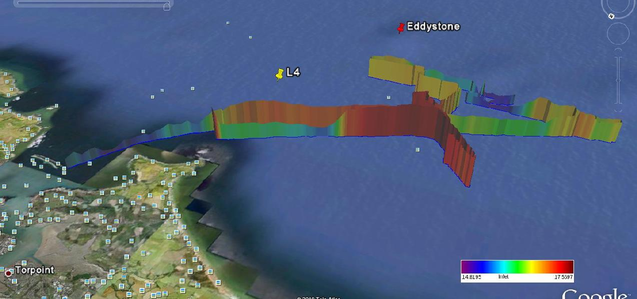
- You should now see a blue line indicating the ship's track.
- All the parameters available for plotting are shown in the menu on the left hand side of the screen. Select one that you are interested in and you will see a control bar appear in the top left of the image screen.
- Left click on the grey pointer and drag it to the right end of the indicator bar then left click on the second pointer, located just behind the first pointer, and drag it back to the left hand side on the indicator bar. You should now be able to see all the data.
- Pressing the play button will play through the file as an animation (by changing the gap between the two pointers, you can set how large a chunk is visible at once). If you click the spanner button you can slow down the animation.
- Also in Google Earth you can view the data from all angles and sides so some positions are more optimal than others.
Contributors
- Project leader: Dr. James Fishwick
- Software development: Dr. Chris Gallienne
- Google Earth visualisation: Dr. Mike Grant
Thanks to the crew of the R.V.Plymouth Quest for all their efforts during the installation and in the routine running of the system.